
Enquires@newsofbitcoin.com

The crypto market has been in a mixture of an extended bearish period over the last month, with the total market cap down. Against this backdrop, Tron (TRX) has also been trading lower, though showing some bullish resilience at times.
As of writing on April 1st, 2024, TRX is trading at $0.1213 per coin. This represents a 13.79% decline over the past month, though just a 0.80% drop over the last 24 hours. Tron’s market capitalization currently stands at $10.6 billion, making it the 16th largest cryptocurrency by that metric.
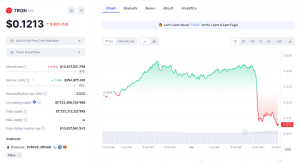

TRON Data Chart (CoinMarketCap)
Trading volume for TRX over the last 24 hours stands at $254.7 million, while the volume to market cap ratio, an indicator of trader interest, registered a healthy 2.33% for Tron. There are currently 87.73 billion TRX coins in circulation out of a peak supply of the same 87.73 billion. This highlights Tron’s commitment to a deflationary monetary policy aimed at increasing the scarcity and potential value of each TRX coin over time.
In fact, on March 31st alone, the Tron network burned (permanently destroyed) over 9.6 million TRX tokens as part of this deflationary program. With a net burn rate that exceeds new issuance by over 4.5 million TRX, the monetary base is programmatically contracting, theoretically increasing the value of each remaining coin.
#TRON just burned 9,605,886 #TRX on March 31st 🔥 showcasing a commitment to deflation & value growth 🚀 With a net negative production ratio of -4,539,551 🤯 pic.twitter.com/0ZGGhdMNAI
— TRON Community (@TronixTrx) April 1, 2024
TRON Technical Analysis
Shifting to the technical picture, on higher timeframes like the weekly and monthly charts, Tron has been locked in a bearish trend since facing stiff resistance at the $0.1450 price level in late February. However, an ascending trendline has established itself as a key support over the past few weeks.
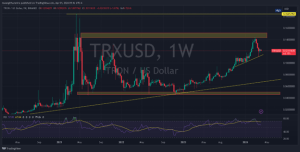

TRXUSD Weekly Chart (TradingView)
On the daily chart, TRX has been trading in a tighter range, with the most recent bounce occurring on March 19th off the afore mentioned ascending trendline support. While prices have turned higher since then, the overall direction remains tilted bearish unless the $0.1450 resistance can be convincingly cleared.
Intraday, TRX opened April 1st trading at $0.1225 and has so far recorded a high of $0.1239 and low of $0.1207, signaling some bullish momentum. The 4-hour chart confirms the bounce from trend support. However, with the Relative Strength Index (RSI) indicator lingering in neutral territory around 49.68, the jury is still out on whether this move higher can be sustained.
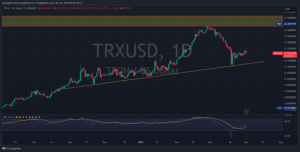
TRXUSD Daily Chart (TradingView)
Market analysts caution that if the ascending trendline breaks to the downside, Tron could see a more protracted bearish downdraft test stronger support levels below the current trading range. But for now, the deflationary dynamics and recent technicals suggest TRX could continue bucking the broader bearish headwinds facing the wider crypto market.
Read More: TRX Battles Bears Amid Bearish Broader Crypto Market. Price Dropped Over 13% In The Last
Disclaimer:The information provided on this website does not constitute investment advice, financial advice, trading advice, or any other sort of advice and you should not treat any of the website’s content as such. NewsOfBitcoin.com does not recommend that any cryptocurrency should be bought, sold, or held by you. Do conduct your own due diligence and consult your financial advisor before making any investment decisions.