
Enquires@newsofbitcoin.com


- Bitcoin price reclaiming above $59,200 would hint that BTC has already bottomed out, setting the tone for a run north.
- Ethereum price holding above $2,900 keeps a bullish reversal pattern viable despite falling momentum.
- Ripple price coils up for a move north as XRP bulls defend $0.5000
Bitcoin (BTC) price slipped below $60,000 on Wednesday as markets tried to front-run the Federal Open Market Committee (FOMC) meeting.
In the mid-April meeting, the Fed alleged new uncertainty concerning whether it could cut rates later this year because of inflation data from the previous quarter. This had markets anticipate a rate hike, causing Bitcoin price to dump, going as low as the $56K range.
In a surprising twist on Wednesday, however, the Fed decided to keep rates unchanged, with the improved sentiment sending BTC back into the $58,000 range.
The sentiment has extended to Ethereum (ETH) and Ripple (XRP) prices as they continue to hold above key support levels.
Also Read: Relief wave on altcoins likely as Bitcoin price shows a $5,000 range
Key level to watch as Bitcoin price slowly grinds up
Bitcoin price drop on Wednesday saw it draw close to testing the Bull Market Support Band at $55,831. However, dovish news from the FOMC may have turned around fortunes as the BTC price is slowly grinding up. If the bulls can manage to haul BTC back above the $59,200 level, it could solidify the recovery, effectively meaning that BTC has bottomed out at $56,552.
In the meantime, Bitcoin price remains in the woods amid falling momentum and growing bearish sentiment, as shown by the Relative Strength Index (RSI) and the Awesome Oscillator (AO) momentum indicators.
If the Bull Market Support band fails to hold as support, Bitcoin price could extend the fall toward the $52,000 threshold, or in a dire case, test the $50,000 psychological level.
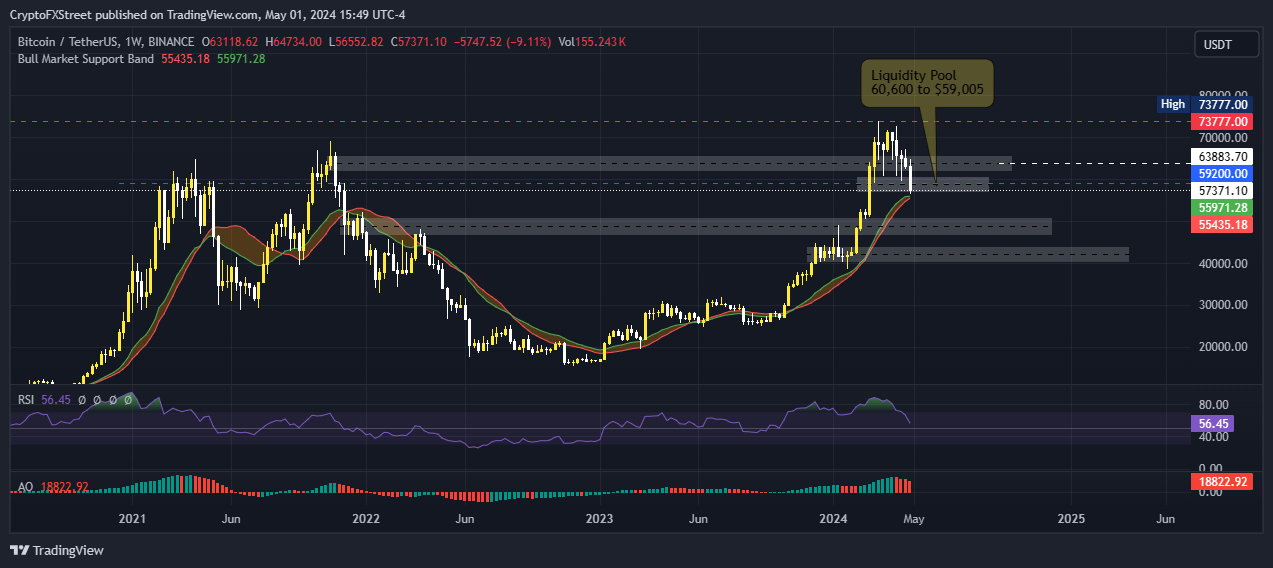
BTC/USDT 1-week chart
Conversely, with the RSI holding well above the mean level of 50, and the AO still in positive territory, all hope is not lost for BTC bulls. And while a flip of $59,200 into support would solidify a recovery rally, the bearish thesis will only be invalidated once BTC breaks and closes above $72,000.
Also Read: Bitcoin price reclaims $59K as Fed leaves rates unchanged
Ethereum price still flirts with 25% upside potential
Ethereum price is consolidating within a falling wedge pattern. This bullish pattern will be executed after a decisive breakout above the upper trendline in the one-day timeframe.
The target objective for this pattern is a 25% move toward $4,250, determined by measuring the height of the wedge and superimposing it at the expected breakout point. The descending wedge pattern remains viable, given that the Ethereum price continues to hold above $2,900 in the 12-hour timeframe.
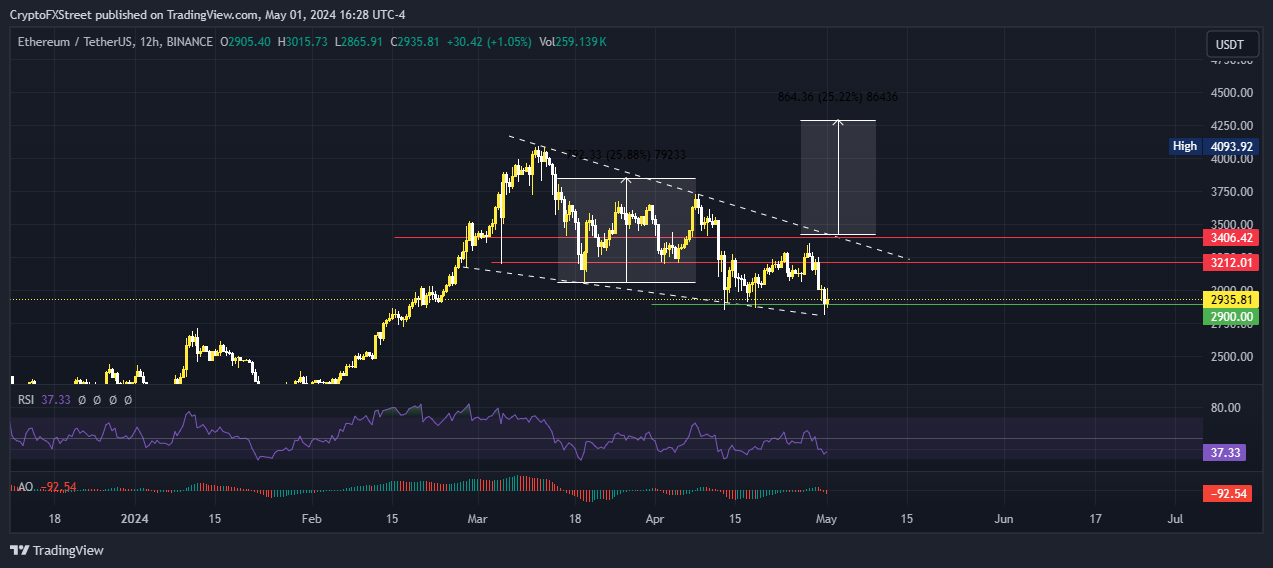
ETH/USDT 12-hour chart
On the other hand, with the lower highs of the RSI, the bears could have their way, sending Ethereum price below the $2,900 buyer congestion level. Such a move would not only negate the bullish reversal pattern but also encourage more sell orders.
Traders looking to open long positions for ETH should wait for the RSI to reclaim above 50 mean level, a move that could be accompanied by a bounce of Ethereum price above the lower boundary of the pattern. A 12-hour candlestick close above $3,212 would provide a good entry.
Ripple price defends against further downside
Ripple price could pivot around $0.4952, marked by the 50% Fibonacci placeholder, as XRP bulls show commitment to defend the $0.5000 threshold. The RSI has managed to record higher lows in the one-day timeframe, which points to growing bullish momentum.
Increased buying pressure could see the XRP price bounce with the prospect of reclaiming the $0.5715 peak of the range. In a highly bullish case, the gains could be seen in the rippling price foray above $0.6000, which is almost 17% above current levels.
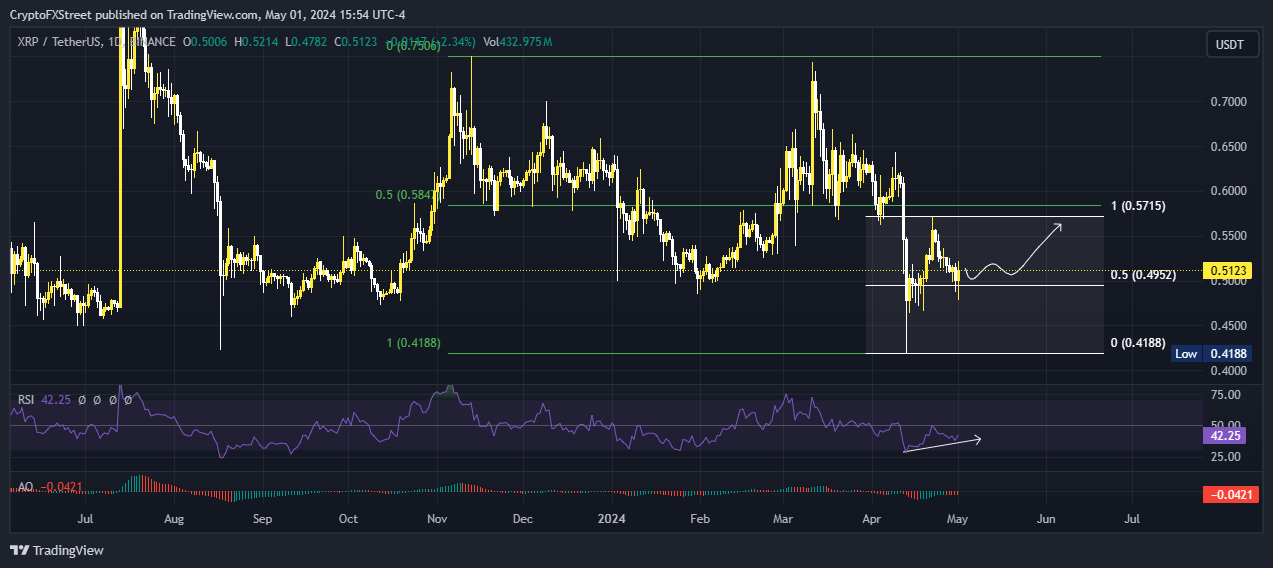
XRP/USDT 1-day chart
On the flip side, if the 50% Fibonacci placeholder fails to hold as a support, the Ripple price could drop. A candlestick close below $0.4782 would produce a lower low, hinting at a possible trend reversal.
Spooked holders would then pull the trigger, sending Ripple price below the $0.4500, or in a dire case, roll over to $0.4188. This would mean a fall of nearly 20% below current levels.
Also Read: XRP sustains above $0.50 as traders digest news of Ripple XRP Ledger entry in the Japanese market.
Cryptocurrency prices FAQs
Related Posts
Read More: Top 3 Price Prediction Bitcoin, Ethereum, Ripple: Altcoins to pump once BTC bottoms out,
Disclaimer:The information provided on this website does not constitute investment advice, financial advice, trading advice, or any other sort of advice and you should not treat any of the website’s content as such. NewsOfBitcoin.com does not recommend that any cryptocurrency should be bought, sold, or held by you. Do conduct your own due diligence and consult your financial advisor before making any investment decisions.