
Enquires@newsofbitcoin.com

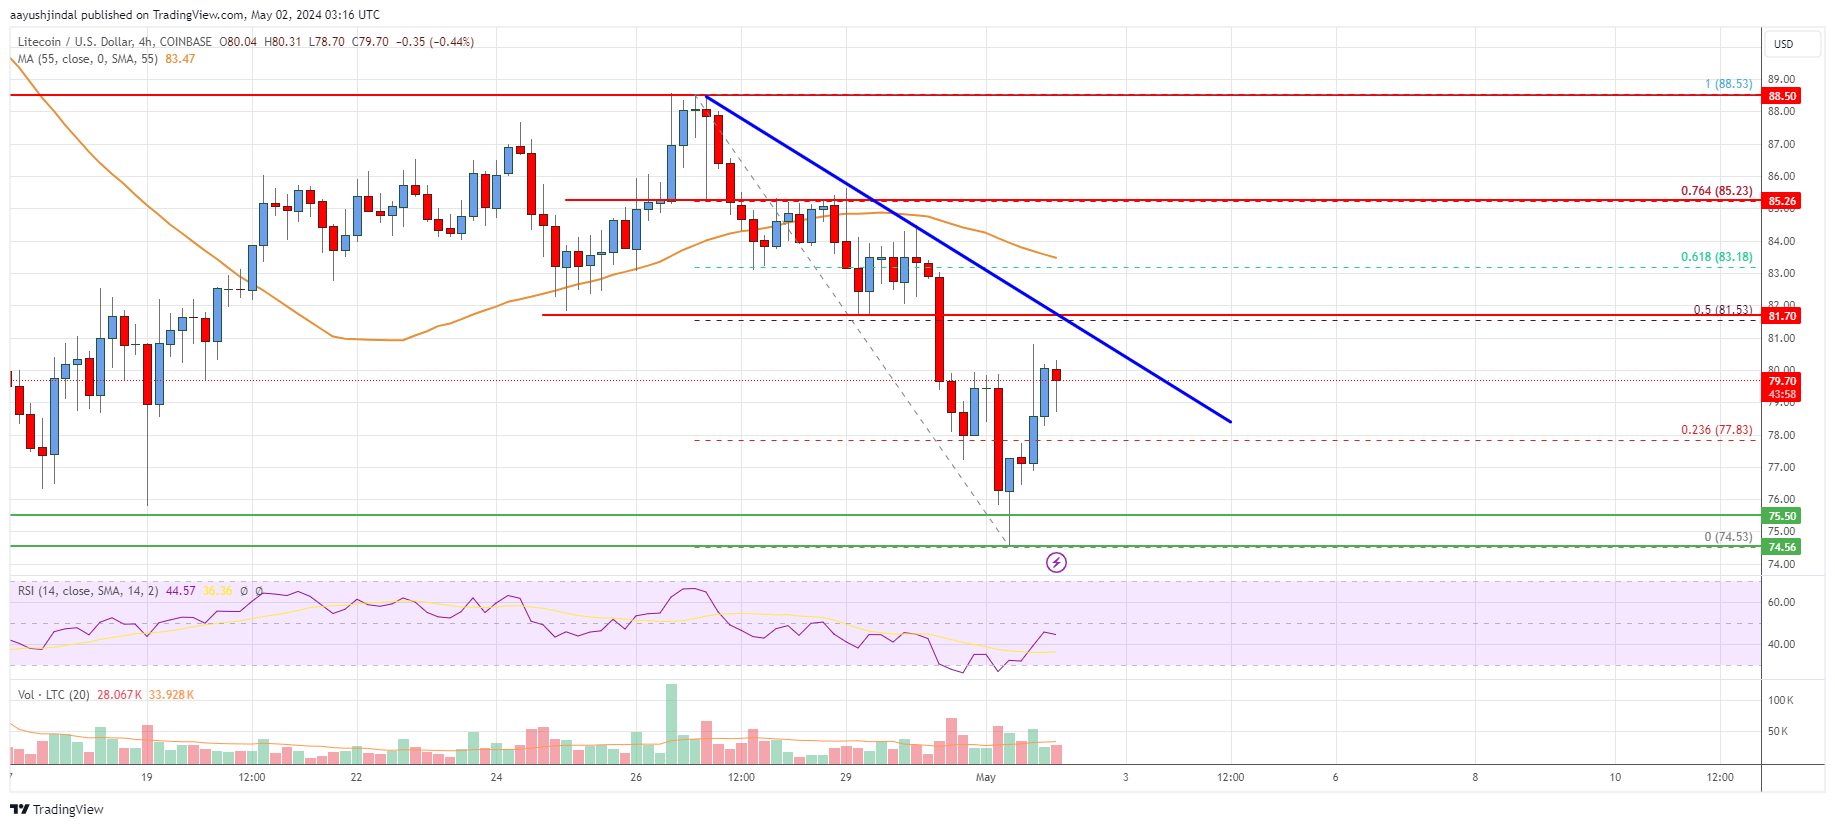
- Litecoin started a fresh decline from the $88 resistance zone against the US Dollar.
- LTC price is now trading below $85 and the 55 simple moving average (4 hours).
- There is a major bearish trend line forming with resistance near $81.50 on the 4-hour chart of the LTC/USD pair (data feed from Coinbase).
- The pair could continue to move down unless the bulls protect the $75.00 support zone.
Litecoin price is struggling below $85.00 against the US Dollar, like Bitcoin. LTC price could continue to decline if it stays below the $82.00 resistance zone.
Litecoin Price Analysis
In the past few sessions, there was a steady decline in Bitcoin, Ethereum, Ripple, and Litecoin against the US Dollar. Earlier, LTC struggled to clear the $88 resistance and started a fresh decline.
The price broke the $85 support zone to enter a bearish zone. The bears even pushed the price below the $80 support zone. It tested the $75 zone. A low has formed near $74.53, and the price recently attempted a recovery wave.
It climbed above the $77.50 resistance. There was a move above the 23.6% Fib retracement level of the downward move from the $88.53 swing high to the $74.53 low.
However, the bears are active near the $80.00 zone. It is now trading below $82.00 and the 55 simple moving average (4 hours). Immediate resistance is near the $81.50 level. There is also a major bearish trend line forming with resistance near $81.50 on the 4-hour chart of the LTC/USD pair.
The trend line is near the 50% Fib retracement level of the downward move from the $88.53 swing high to the $74.53 low. The next major resistance is near the $83.20 level.
The main resistance sits near the $85 zone. A clear move above the $85 level could pump the price toward the $92.00 level. The next major resistance could be $100.
On the downside, immediate support is near the $77.80 level. The next key support is near the $75.00 level. If there is a downside break below the $75.00 support, the price could accelerate lower toward the $68.00 level in the near term.

Looking at the chart, Litecoin price is clearly trading below $85.00 and the 55 simple moving average (4 hours). Overall, the price could continue to move down unless the bulls protect the $75.00 support zone.
Technical indicators
4 hours MACD – The MACD for LTC/USD is now losing pace in the bearish zone.
4 hours RSI (Relative Strength Index) – The RSI for LTC/USD is now below the 50 level.
Key Support Levels – $77.50 and $75.00.
Key Resistance Levels – $82.00 and $85.00.
Read More: Litecoin (LTC) Price Analysis: Recovery Could Be Capped Near $82 | Live Bitcoin News
Disclaimer:The information provided on this website does not constitute investment advice, financial advice, trading advice, or any other sort of advice and you should not treat any of the website’s content as such. NewsOfBitcoin.com does not recommend that any cryptocurrency should be bought, sold, or held by you. Do conduct your own due diligence and consult your financial advisor before making any investment decisions.