
Enquires@newsofbitcoin.com


- XRP price is attempting a fresh increase from the $0.4750 support against the US dollar.
- The price is now trading above $0.500 and the 55 simple moving average (4 hours).
- There was a break above a key bearish trend line with resistance at $0.5050 on the 4-hour chart of the XRP/USD pair (data source from Kraken).
- The pair could continue to rise if it clears the $0.5350 resistance.
XRP price is consolidating above $0.5150 against the US Dollar, like Bitcoin. It must stay above the $0.5050 support to continue higher in the near term.
XRP Price Analysis
After forming a base above the $0.4750 level, XRP price started a fresh increase against the US Dollar. The XRP/USD pair broke the $0.4850 and $0.500 resistance levels to enter a positive zone.
There was a break above a key bearish trend line with resistance at $0.5050 on the 4-hour chart of the XRP/USD pair. The pair even cleared the 50% Fib retracement level of the downward wave from the $0.5705 swing high to the $0.4787 low.
The price is now trading above $0.5150 and the 55 simple moving average (4 hours). On the upside, the price is facing resistance near $0.5350. It is near the 61.8% Fib retracement level of the downward wave from the $0.5705 swing high to the $0.4787 low.
The first key resistance is near the $0.5420 level. The next major resistance is near the $0.550 level. A clear move above the $0.550 resistance zone might start a strong increase. In the stated case, the price could even surpass the $0.570 zone and test $0.600. Any more gains might send the price toward the $0.620 resistance.
Initial support on the downside is near the $0.5180 level. The next major support is near the $0.5050 level. Any more losses could lead the price toward the $0.4850 level, below which the price might even test the $0.4780 support zone in the near term.
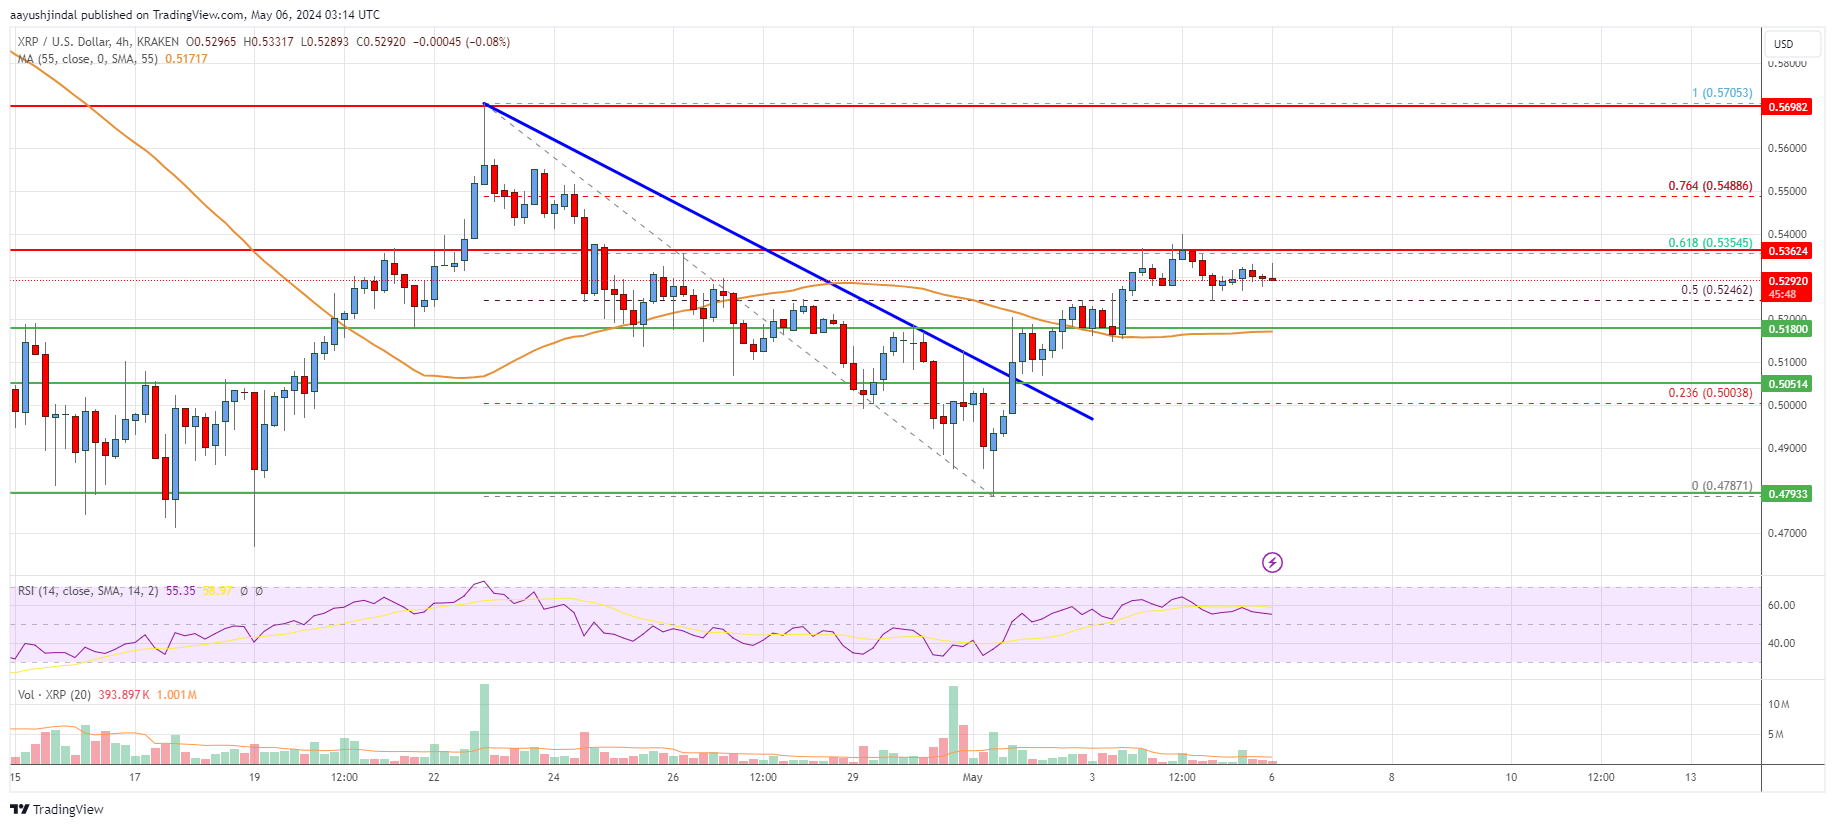
Looking at the chart, XRP price is now trading above the $0.5150 zone and the 55 simple moving average (4 hours). Overall, the price could start a fresh increase above the $0.5350 resistance.
Technical indicators
4 hours MACD – The MACD for XRP/USD is now losing momentum in the bullish zone.
4 hours RSI (Relative Strength Index) – The RSI for XRP/USD is above the 50 level.
Key Support Levels – $0.5180, $0.5050, and $0.480.
Key Resistance Levels – $0.5350 and $0.5700.
Read More: XRP Price Analysis: Can Bulls Clear This Key Hurdle? | Live Bitcoin News
Disclaimer:The information provided on this website does not constitute investment advice, financial advice, trading advice, or any other sort of advice and you should not treat any of the website’s content as such. NewsOfBitcoin.com does not recommend that any cryptocurrency should be bought, sold, or held by you. Do conduct your own due diligence and consult your financial advisor before making any investment decisions.