
Enquires@newsofbitcoin.com


- Ethereum price started a downside correction from the $3,220 resistance against the US Dollar.
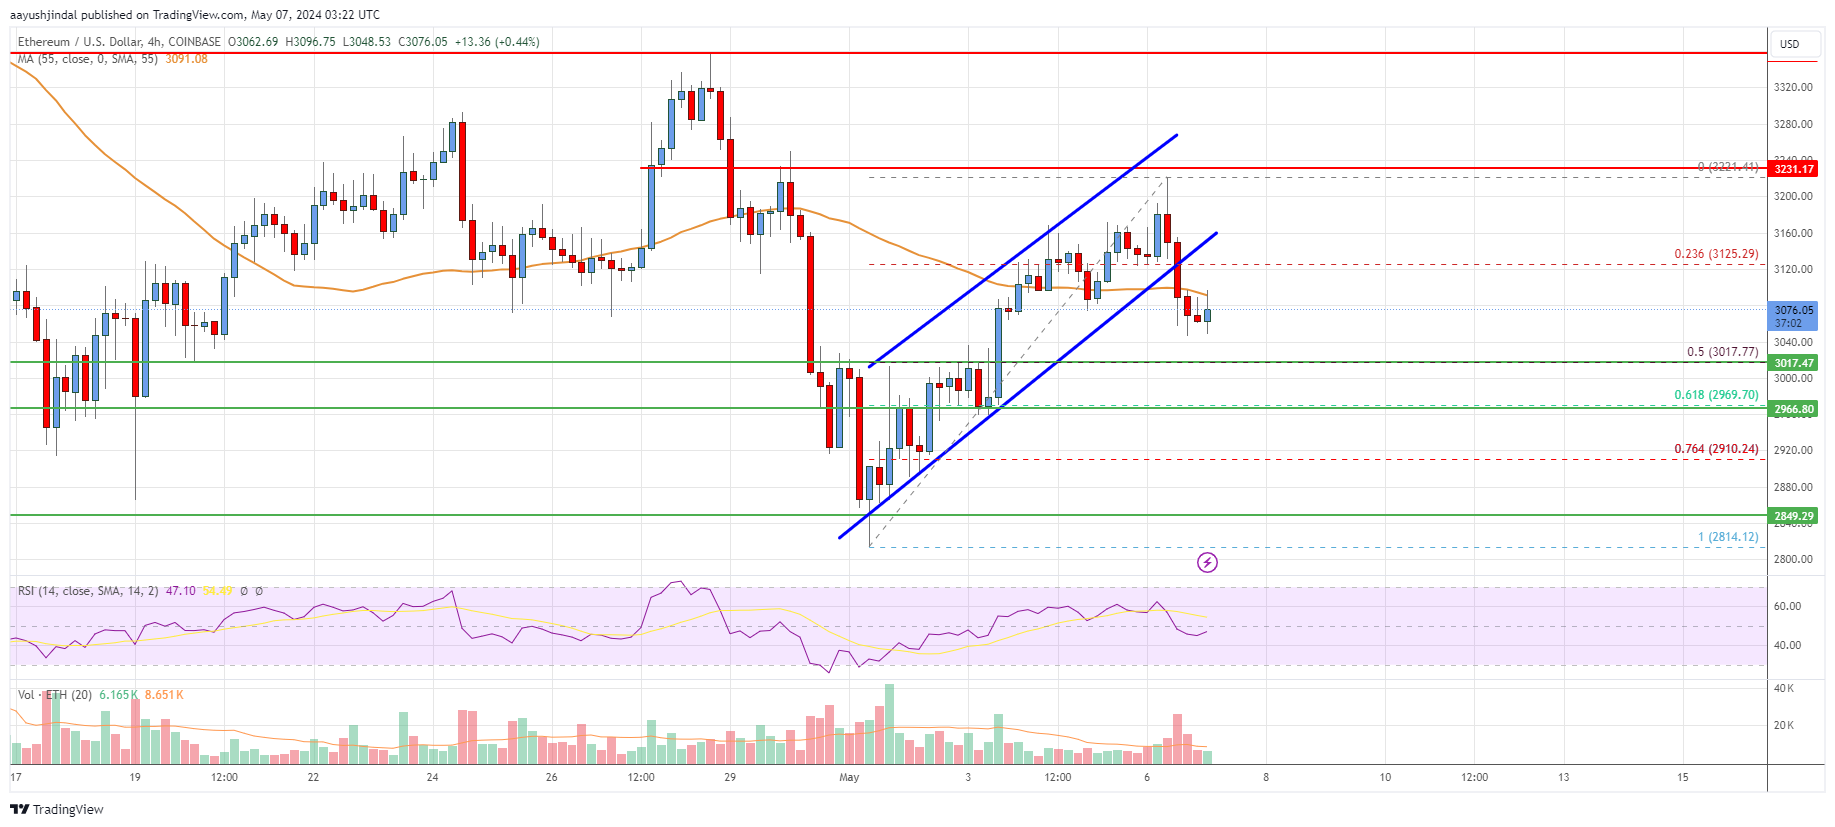
- ETH price is now trading near $3,080 and the 55 simple moving average (4 hours).
- There was a break below a key rising channel with support at $3,125 on the 4-hour chart (data feed from Coinbase).
- The pair could start a fresh increase if it clears the $3,220 resistance zone.
Ethereum price is declining below $3,150 against the US Dollar. ETH/USD remains at a risk of more downsides below the $3,020 support zone.
Ethereum Price Analysis
In the past few days, Ethereum started a decent increase above the $3,050 resistance zone against the US Dollar. ETH price climbed above the $3,120 and $3,150 resistance levels.
Finally, it tested the $3,220 resistance zone. A high was formed near $3,221 before there was a downside correction. There was a move below the $3,200 support zone. The price even traded below the 23.6% Fib retracement level of the upward wave from the $2,814 swing low to the $3,221 high.
There was a break below a key rising channel with support at $3,125 on the 4-hour chart. ETH is now trading near $3,080 and the 55 simple moving average (4 hours).
On the upside, the price is now facing resistance near the $3,125 level. The first major resistance is near the $3,200 level. The next major resistance is near the $3,220 zone. A clear move above the $3,220 resistance level might call for a fresh move to $3,350.
Any more gains could even send the price toward the $3,400 resistance zone or even $3,500 in the near term. On the downside, initial support is near the $3,020 level or the trend line and the 50% Fib retracement level of the upward wave from the $2,814 swing low to the $3,221 high.
The next major support is now near the $2,960 level. A break below the $2,960 support could push the price to $2,820. If the bulls fail to protect the $2,820 support, the price might decline toward $2,665.
Looking at the chart, Ethereum price is clearly trading near $3,080 and the 55 simple moving average (4 hours). Overall, Ether price could continue to move down if it breaks the $3,020 support zone.
Technical indicators
4 hours MACD – The MACD for ETH/USD is now losing momentum in the bullish zone.
4 hours RSI (Relative Strength Index) – The RSI for ETH/USD is now below the 50 level.
Key Support Levels – $3,020, followed by the $2,960 zone.
Key Resistance Levels – $3,125 and $3,220.
Read More: Ethereum Price Analysis: ETH Faces Key Uptrend Resistance | Live Bitcoin News
Disclaimer:The information provided on this website does not constitute investment advice, financial advice, trading advice, or any other sort of advice and you should not treat any of the website’s content as such. NewsOfBitcoin.com does not recommend that any cryptocurrency should be bought, sold, or held by you. Do conduct your own due diligence and consult your financial advisor before making any investment decisions.